·
6 minutes
Algorithmic Midnight-Grid and Turning Points Accuracy on March 3, 2026: Live ES, NQ, and YM Futures Breakdown

Algorithmic
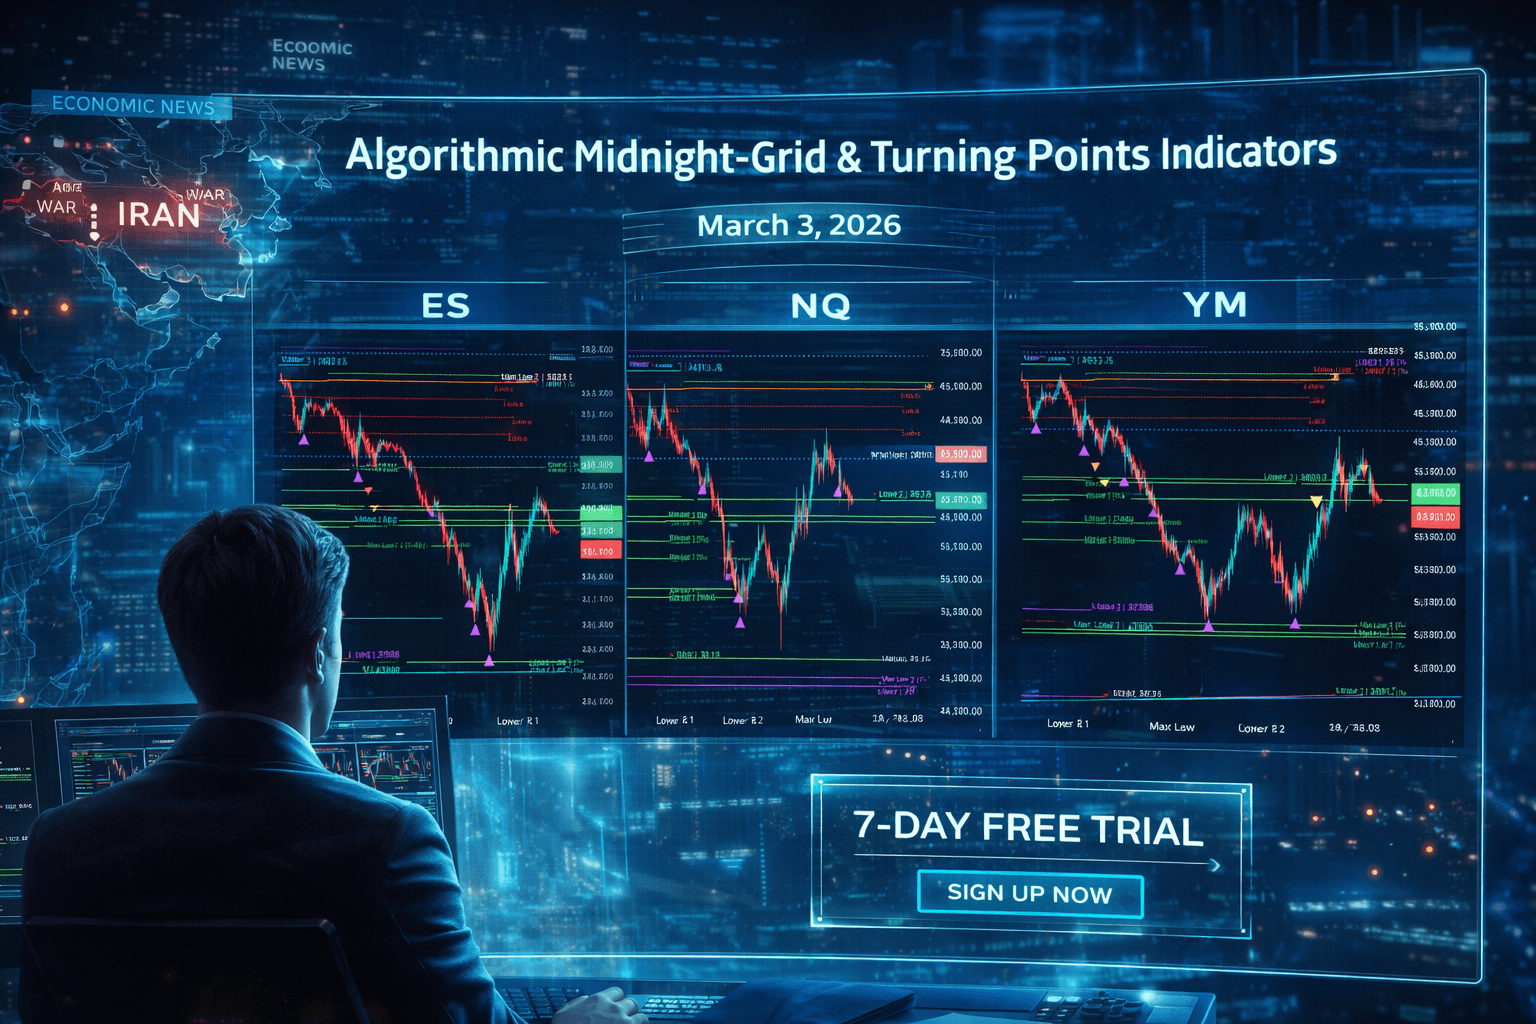
Algorithmic Out in the Wild: March 3, 2026 Futures Breakdown
March 3, 2026 was not a quiet session.
Markets were navigating ongoing macro uncertainty, persistent inflation narratives, and geopolitical tensions that continue to ripple through global risk assets. Headlines around economic data and international conflict create noise. Index futures respond instantly. Volatility rotates. Liquidity shifts.
But at Midnight ET, before the cash open, before the news cycle accelerates, the Algorithm had already done its work.
The Midnight-Grid calculated structure.
Later Turning Points displayed behavior.
What followed was not random.
It was structure unfolding.
The Full Market View: ES, NQ, and YM in Confluence
[ SCREENSHOT: All 3 Indexes – ES, NQ, YM]
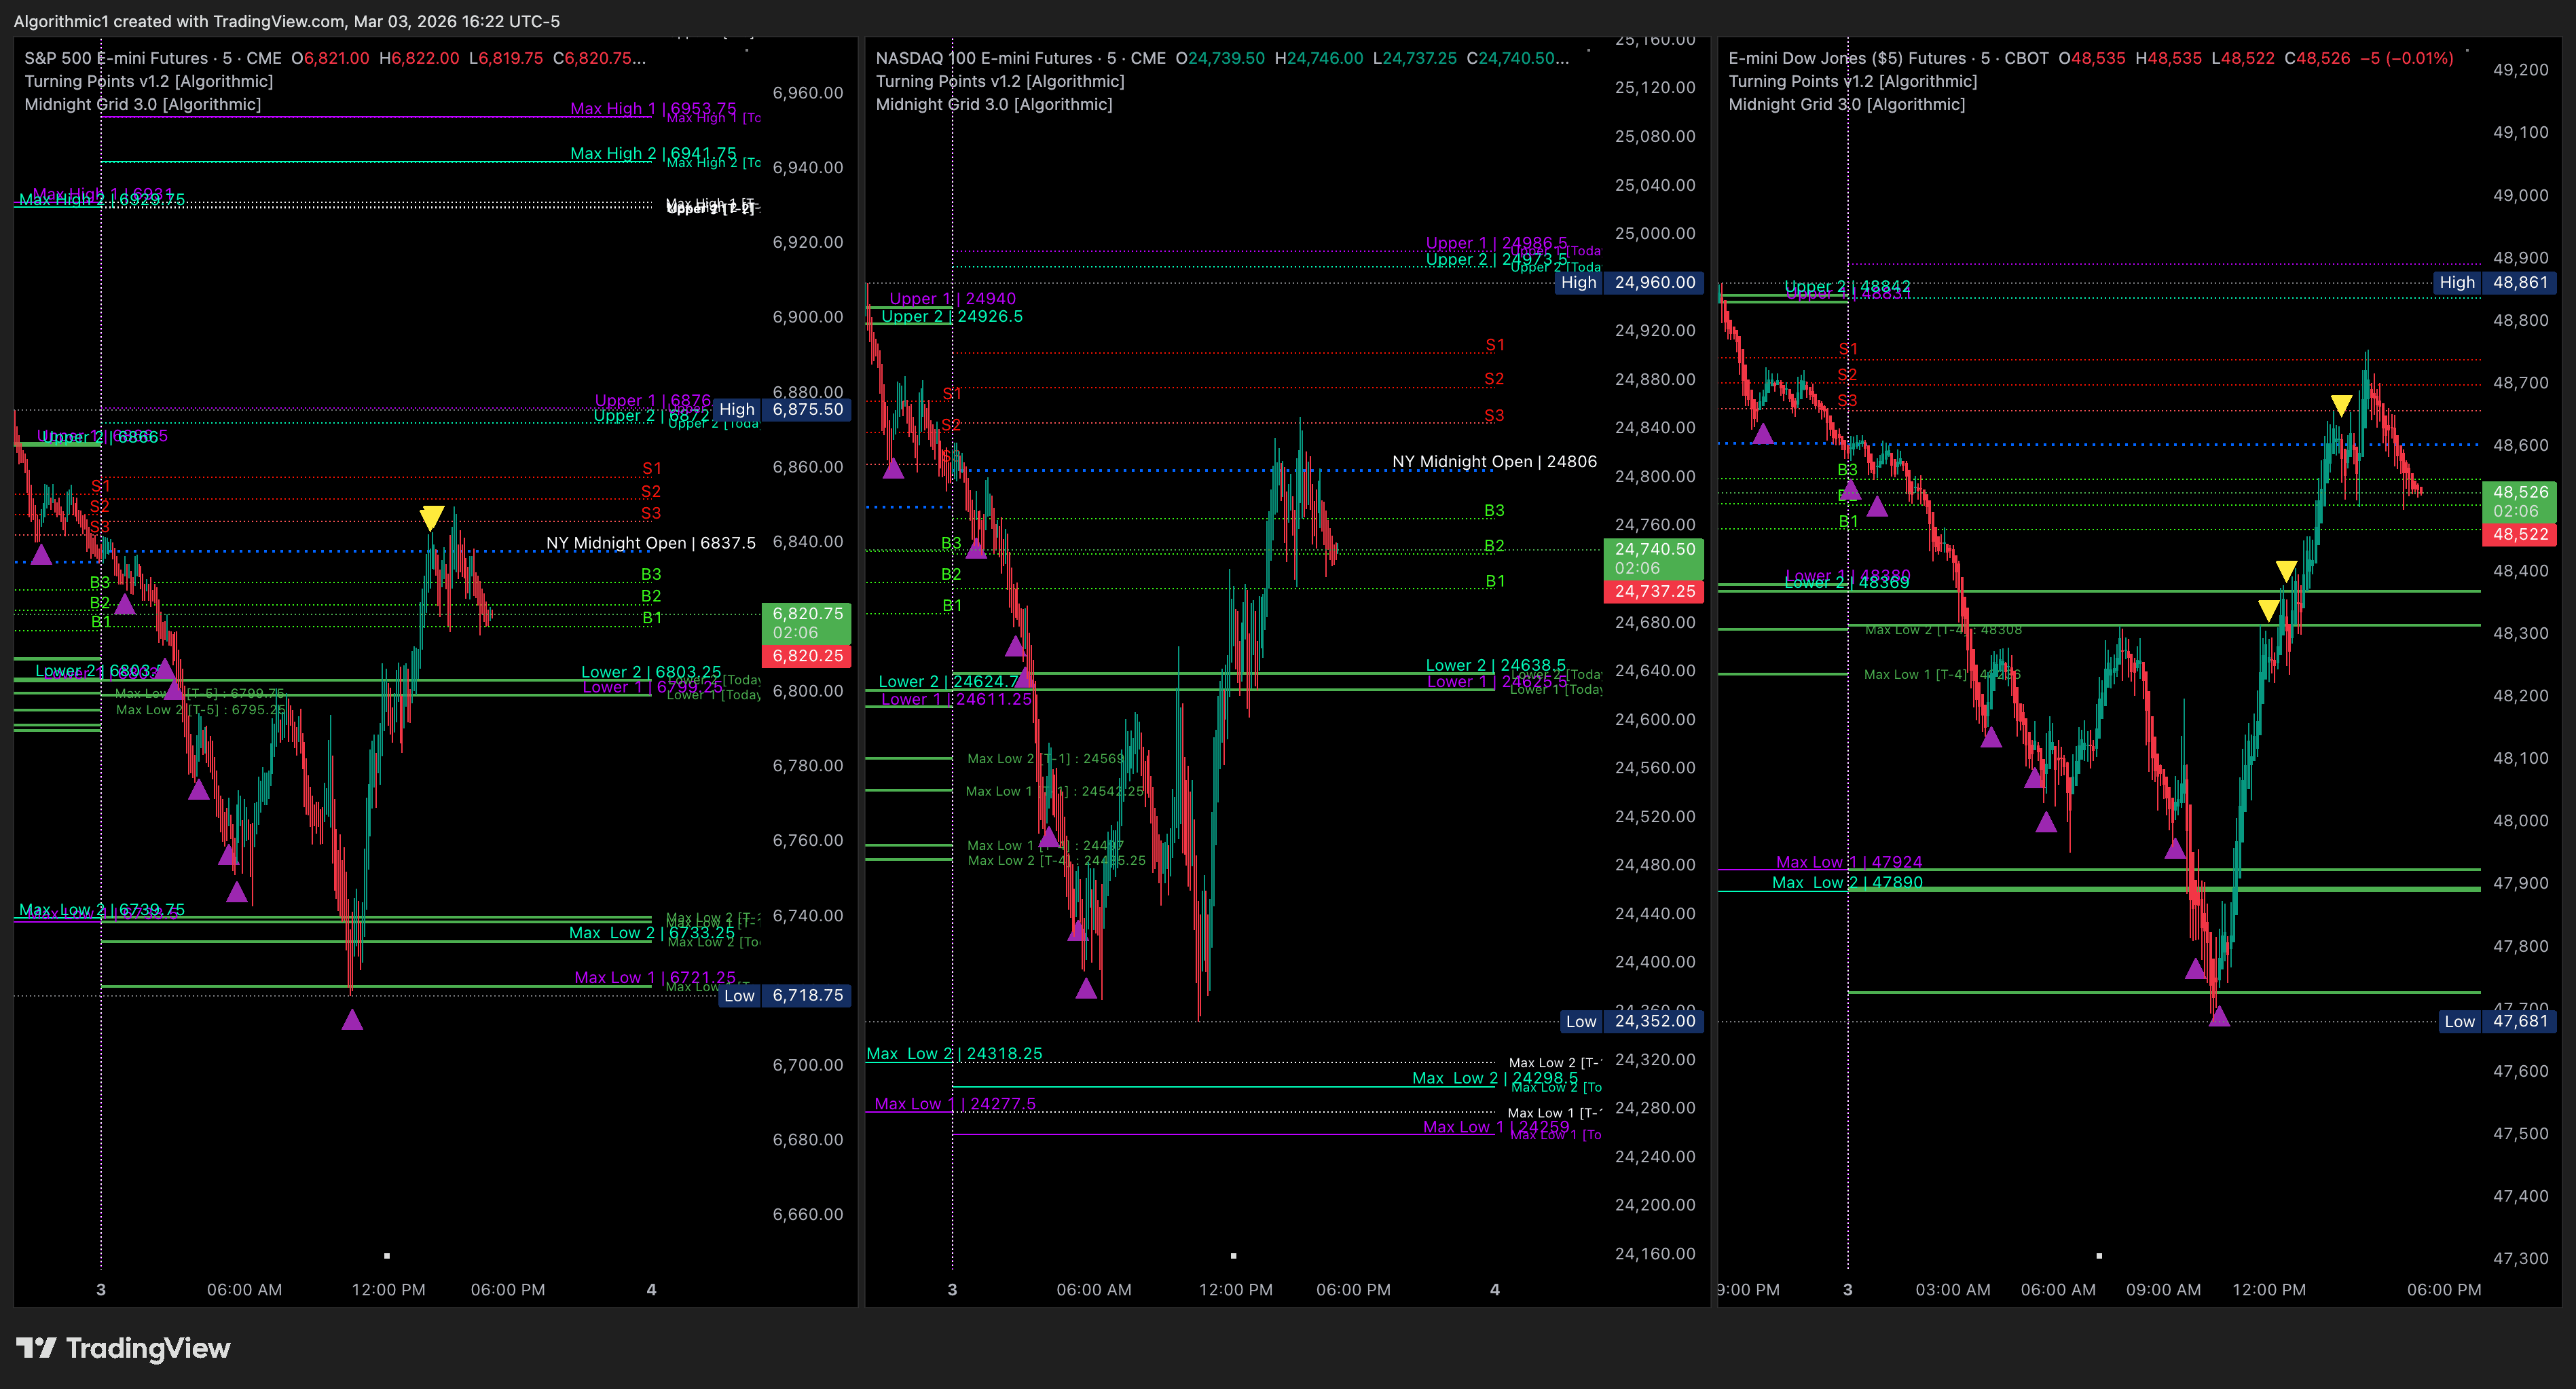
The first screenshot shows all three major U.S. index futures on the 5-minute timeframe:
ES (S&P 500 E-mini)
NQ (Nasdaq 100 E-mini)
YM (Dow Jones E-mini)
This is where serious futures traders gain an edge.
Indexes do not trade in isolation. They function as a connected system. Capital rotates between tech-heavy NQ, broad ES exposure, and industrial-heavy YM. When two of the three align at key calculated levels, the probability increases.
On March 3, two of the three indexes came into precise confluence at their Algorithmic levels.
The Early Structure
Overnight, the indexes trended lower into defined Lower Grid and Max Low zones. The Midnight-Grid levels were already plotted:
Lower 1 and Lower 2
Max Low zones
B1, B2, B3 buy levels
S1, S2, S3 algorithmic sell levels
As price descended into those calculated areas, Turning Points began printing purple triangles into weakness.
That is not hindsight labeling.
That is real-time structural detection.
The Long Setup: Confluence Across Indexes
NQ and YM both reached defined lower structure zones and began reclaiming B-levels while ES stabilized near its own calculated Lower region.
When two indexes begin reclaiming structure simultaneously while the third holds support, that is not random strength. That is coordinated market behavior.
The long bias was not based on opinion.
It was based on structure reclaiming structure.
Once B1 and B2 were reclaimed in confluence, upside objectives toward S-levels and Upper Grid bands were statistically favored.
This is why watching all three indexes is imperative. A single chart may hesitate. Two in agreement signal participation. Three in rotation confirm systemic flow.
ES Detailed Breakdown: From Lower Grid to Structured Rally
[ SCREENSHOT: Single ES Chart]
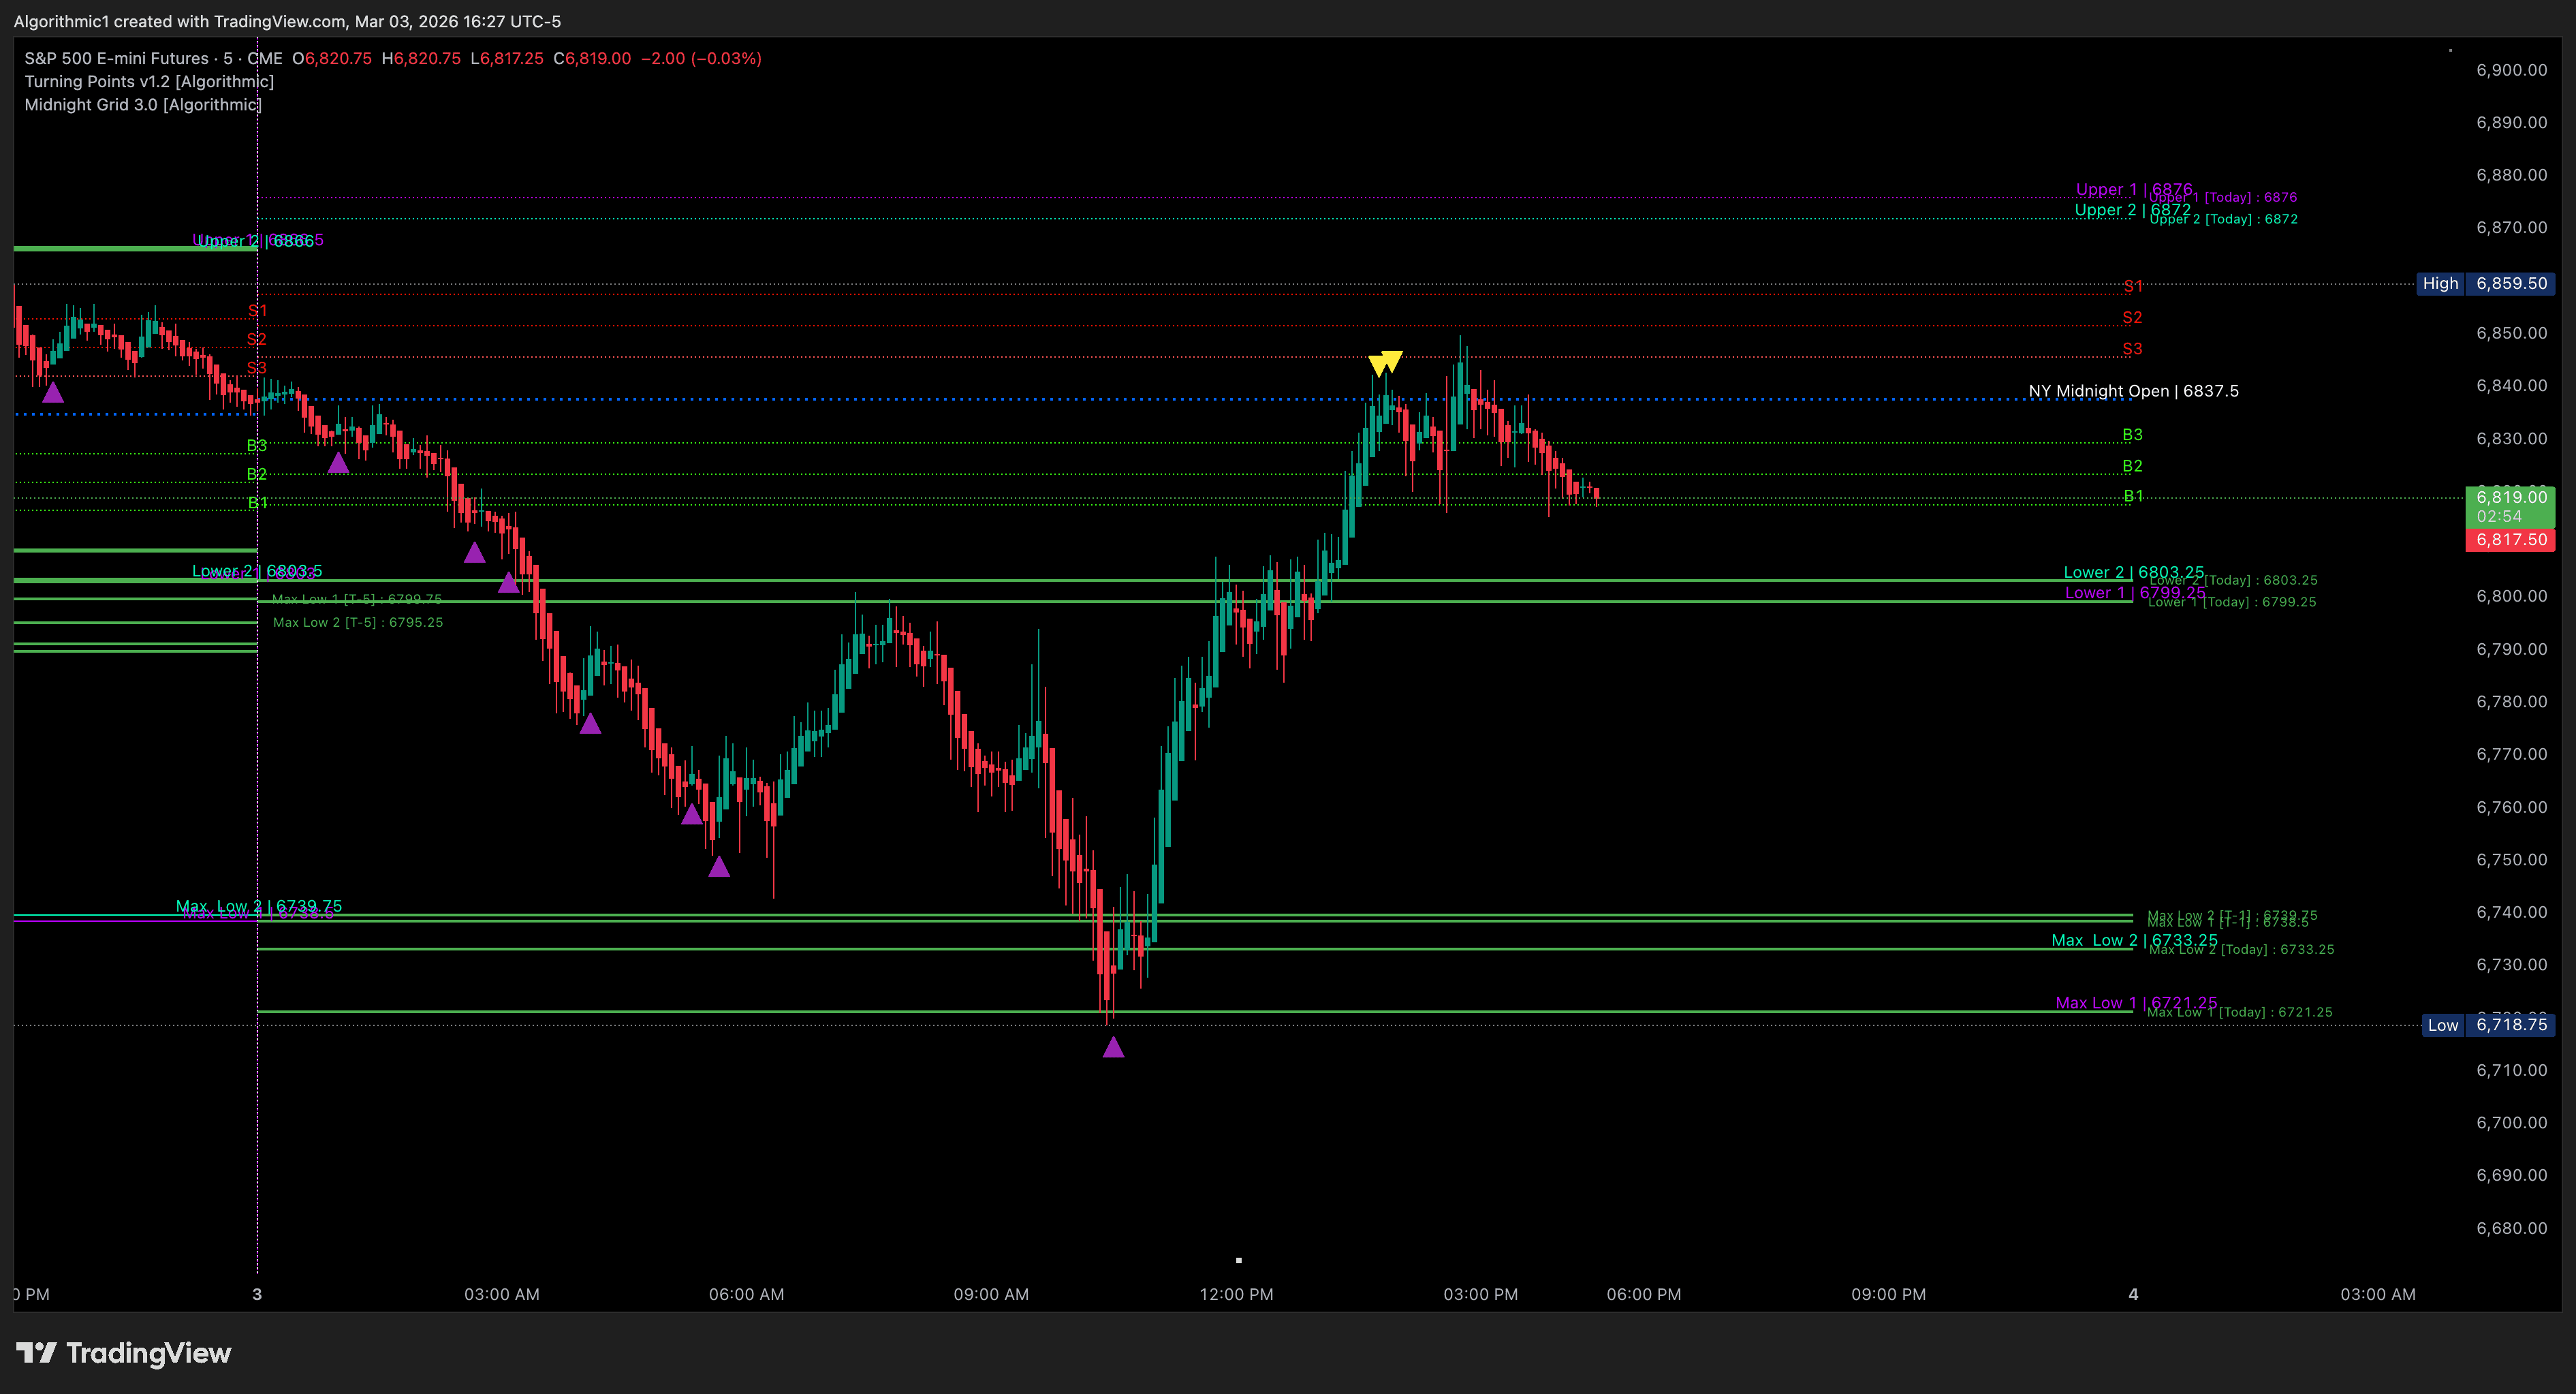
Let’s isolate ES.
Price sold off into the Lower Grid and Max Low zones defined at Midnight. Those green bands were not adjusted intraday. They were calculated hours earlier.
Turning Points printed into the final push lower.
Then structure shifted.
Reclaim of B1
Continuation through B2
Expansion toward NY Midnight Open
Push toward S-level resistance
The yellow Turning Point marker near the local high showed behavior exhaustion into resistance. That was not magic. It was structure meeting objective.
From Lower Grid support to structured rally into resistance, ES respected the Midnight-Grid levels with precision.
For traders executing funded accounts or managing risk at prop firms, that is the difference between guessing and trading a framework.
YM Detailed Breakdown: Clean Reaction from Calculated Levels
[ SCREENSHOT: Single YM Chart]
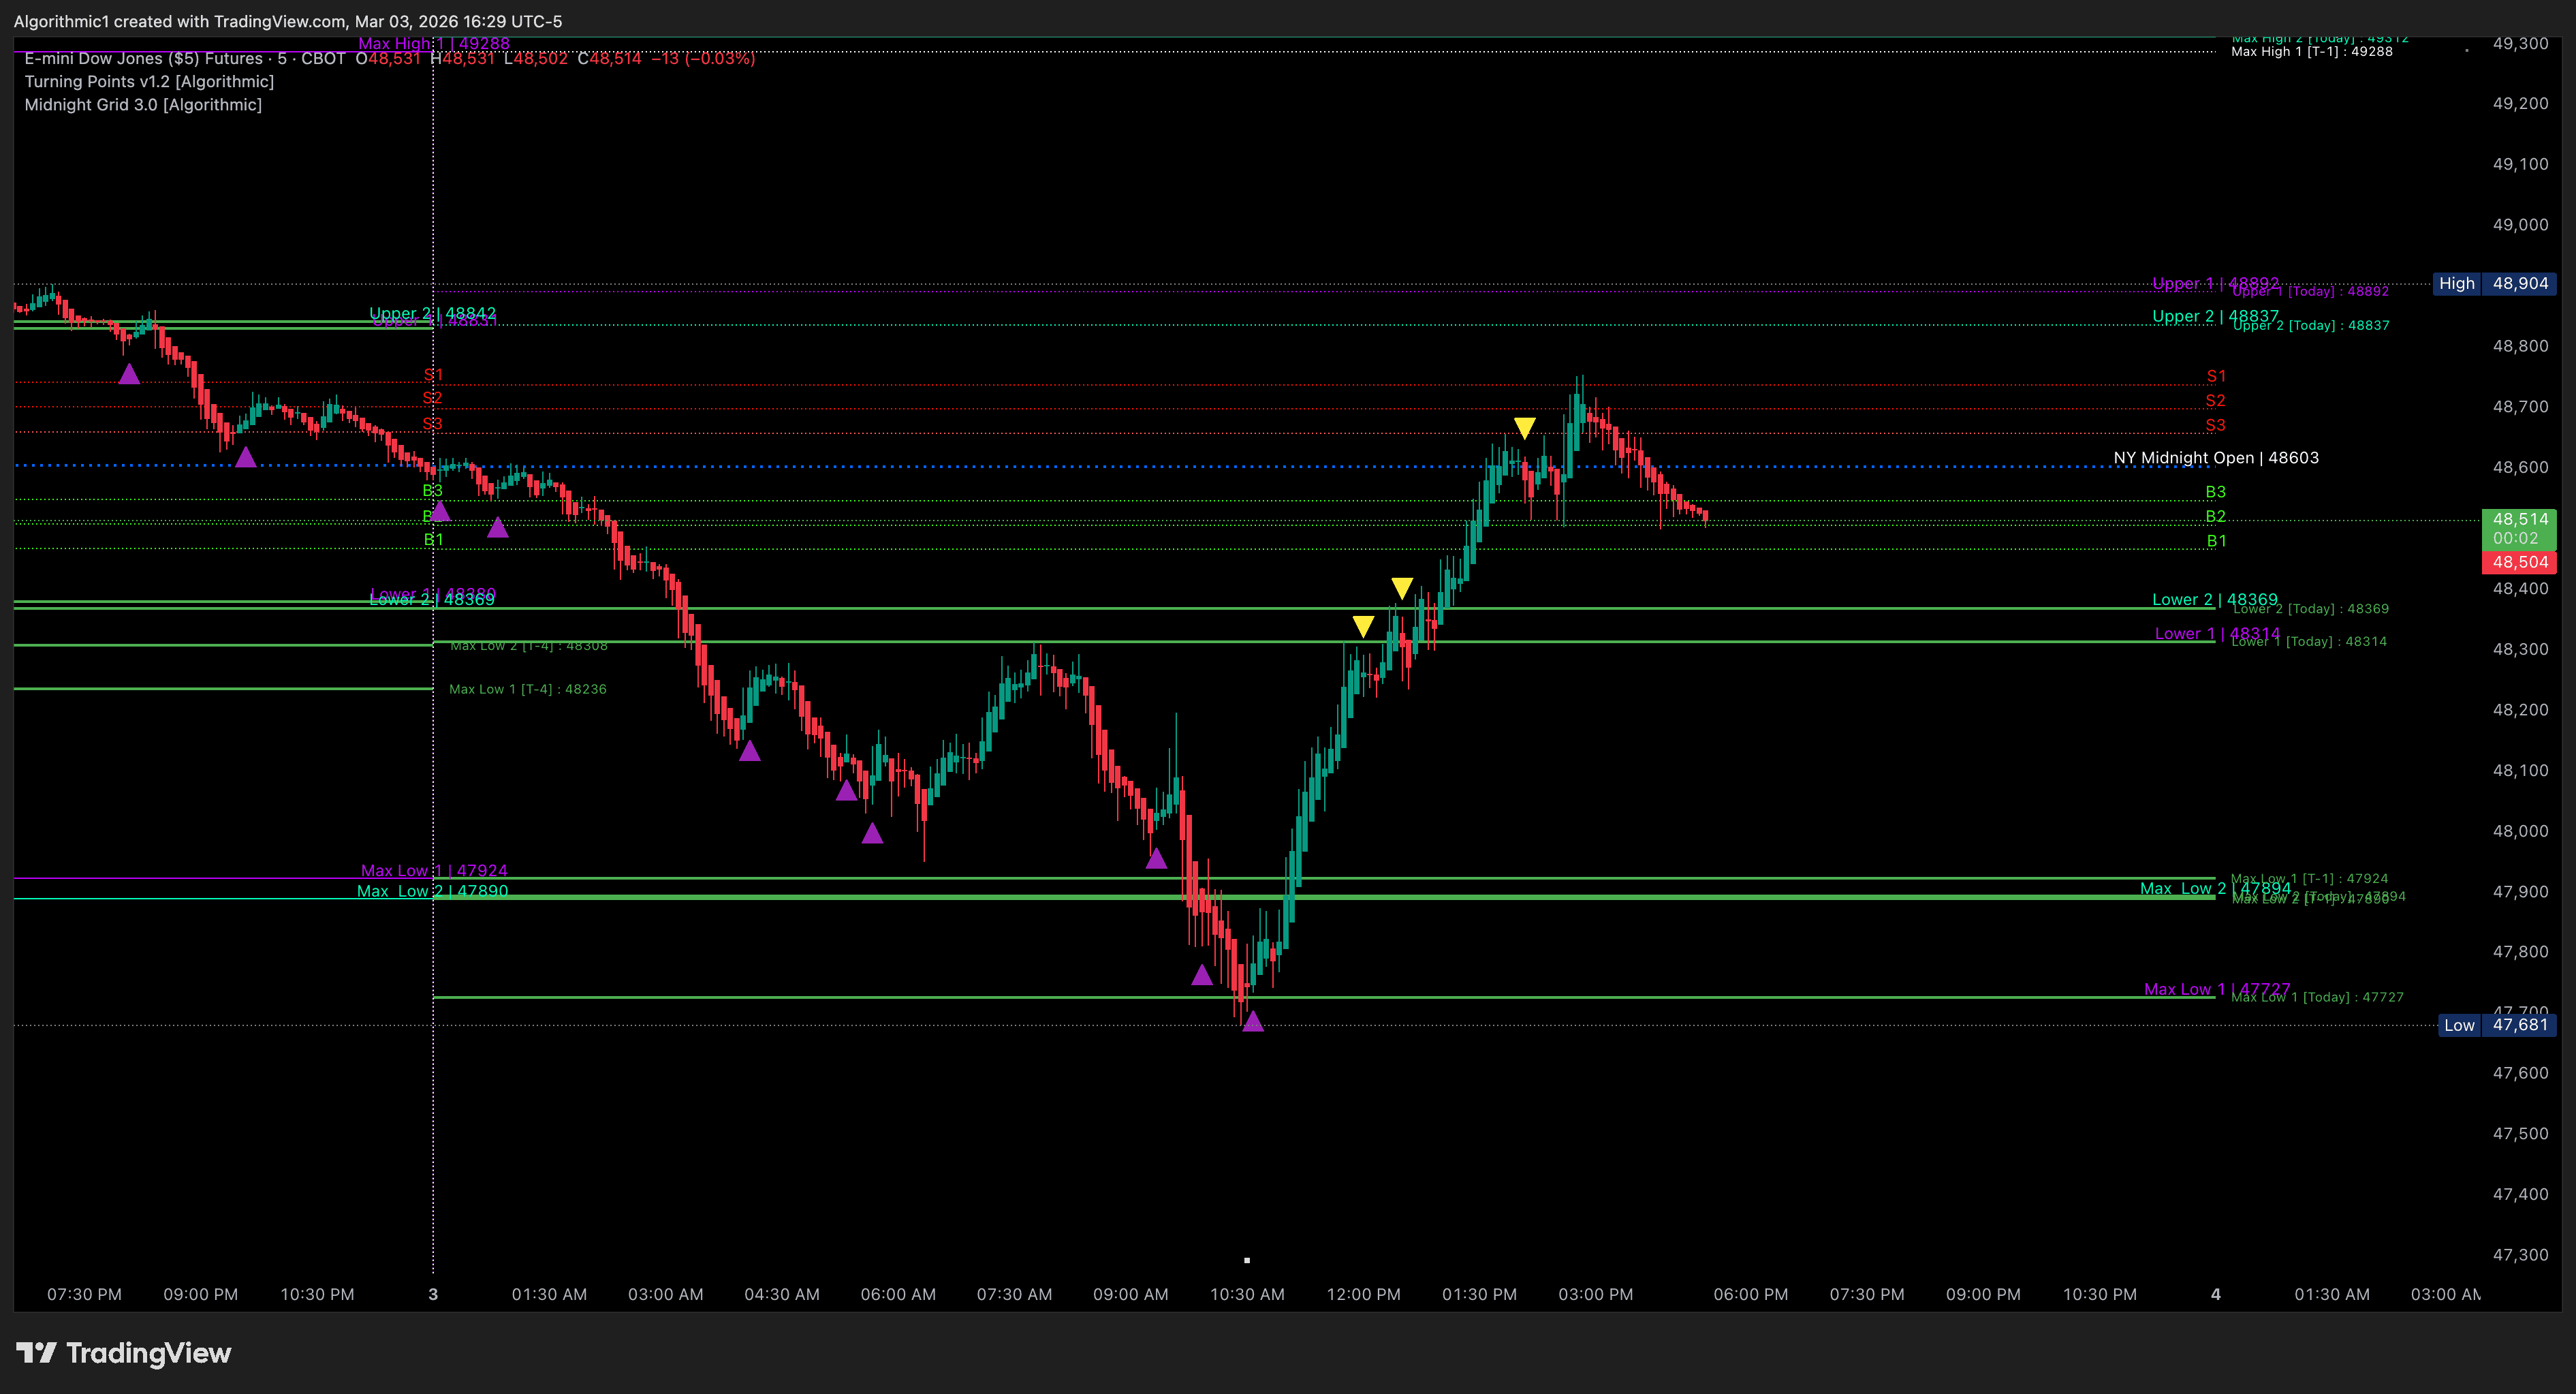
YM provided one of the cleanest demonstrations of structural reaction.
The Dow rotated lower into its Max Low band and printed a sequence of Turning Points into exhaustion.
The reversal began not in the middle of nowhere, but from a pre-defined zone.
Then:
B-level reclaim
Momentum expansion
Measured move into S-level resistance
Turning Point printed near the upper reaction
The entire move unfolded between the grid boundaries calculated at Midnight ET.
That is the power of pre-session structure.
You are not reacting emotionally to headlines about economic releases or geopolitical tension. You are executing around predefined objectives.
Why Midnight Calculation Matters
The Algorithm calculates structure at Midnight ET.
It does not wait for CPI.
It does not wait for geopolitical headlines.
It does not chase volatility.
It maps the terrain before the battle begins.
On March 3, 2026, despite uncertainty in the broader macro environment, ES, NQ, and YM all respected their calculated grid levels.
Algorithmic Support held where it was defined.
Algorithmic Resistance capped where it was projected.
Turning Points flagged exhaustion where behavior shifted.
That is not guru commentary after the fact.
That is live data on your chart.
For the Prop Firm Trader
If you trade funded accounts, you already understand the rules:
Daily drawdown limits
Consistency requirements
No room for emotional overtrading
Structure is everything.
The Midnight-Grid gives you objective levels.
Turning Points give you behavioral timing.
Watching ES, NQ, and YM together gives you systemic confirmation.
March 3 was a textbook example of confluence across indexes initiating a high-probability long rotation from calculated support.
You can either trade off social media opinions.
Or you can trade off structure.
This Is Not Theory
These screenshots are from live market conditions.
Not replay mode.
Not hindsight drawing.
Not hypothetical examples.
Algorithmic indicators plotted structure at Midnight.
Price interacted with that structure throughout the session.
That is what it looks like when an edge is visible on your own chart.
See It Yourself
If you are serious about index futures, you need to see this on your own TradingView charts.
The 7-day free trial gives you full access to:
Midnight-Grid
Turning Points
Real-time calculated structure
All three major index futures
No long-term commitment.
Cancel anytime.
If you do not see the precision for yourself, walk away.
But if you do, you will understand why watching ES, NQ, and YM as a cohesive unit with pre-calculated structure changes how you approach every session.
Structure first.
Execution second.
Emotion never.
Start the 7-day trial and put the Algorithm to work on your chart tomorrow.


